|
|
|
System function and structure
Pdvigil online PD monitoring and detection systems are designed for 7x24 hours continuous monitoring, detecting and diagnosing of PD on various MV and HV power equipment (transformers, switchgears, GIS, cables, etc.). The systems have various configurations that best suit the different types of power equipment. Cable online monitoring systems have an function option of PD location measurement.
The system is generally composed of PD sensors, front-end equipment (data acquisition and processing equipment), network transmission equipment and background diagnosis and monitoring platform. According to the site conditions, optical fiber, Ethernet cable, WiFi and/or 4G wireless connection can be used as transmission medium to form the network. The systems can be configured and deployed in the forms of single stand-alone system, LAN system or WAN system. The background of the WAN can be deployed in the cloud or on the user's own server to achieve remote online monitoring and detection, without being limited by geographic space and distance.
The system can work on its own as a self contained system, or be integrated into a grid SCADA system, or
digital twin system.
|

|
|
Sensors
The system mainly uses high-frequency current sensor (HFCT), but can also use other types of PD sensors like Transient Earth Voltage sensor (TEV), Ultra-High Frequency sensor (UHF), Wide Band Antennas sensor (WBAnt), Ultrasonic sensor, etc.
|
_s.png)
|
|
Data acquisition and processing equipment
(Front End Equipment)
PDVIGIL data acquisition and processing devices are used as front end equipment in the system. They have multiple signal input ports and verification signal output ports. The input ports can be configured to accommodate different types of sensors. The data acquisition and processing devices are permanently installed on the site of the monitored power facilities, connected with the PD sensors through low-loss coaxial cables, and are responsible for signal amplification, filtering and noise reduction, analog-to-digital conversion, digital signal processing, partial discharge signal identification, and transmitting the data to the background platform through the network. Their important features include:
- Multiple input channels, each can be configured to adapt to different types of sensors.
- Have self-verification capability
- The input and output ports have protection circuits and are protected against static and high voltage shock.
- Multi-range design with very large dynamic range, the system can automatically select the best range according to the strength of the input signals.
- Ultra low noise circuitry and multiple layers of noise reduction measures.
- Wideband reception, effectively eliminating the interference of narrowband signals.
- High-speed A/D conversion, obtain more signal information, high-frequency input sampling rate ≧100MSPS.
- Signals are processed in the device with on-board high-performance FPGA + ARM CPU.
- The multi-domain analysis technology is used to separate the signals of different discharge sources.
- Pattern recognition algorithm and AI techniques are used to identify partial discharge signals.
- Operate independently or under control of backend platform.
|


|
|
Backend Monitoring and Diagnosis Platform
The back-end platform consists of the back-end software, cloud or user server and user terminals. The back-end platform can accept connections from multiple number of data acquisition and processing front-end devices, and can accept multiple user display terminal logins, in addition to controlling the operation of the entire system, its main functions include:
-
-
Monitoring mode:
Data processing and PD identification processes are entirely accomplished in the front end devices. When a PD pattern is recognized and found satisfied the preset conditions and thresholds,the front end device sends out an alarm signal. The conditions and thresholds are set through the backend platform.
-
Diagnosis Mode:
The back-end platform reads the raw data from a front-end device, displays the data on the user terminals and enables the operators to review, analyse and diagnose the partial discharges.
-
Self verification / calibration mode:
Under control from the back-end platform, the frond-end device generates and outputs a simulated PD pulse to verify the functionality of the system and calibrate the performance of the sensors and front-end device.
-
In the monitoring operation mode, it receives status prompts and alarm signals sent from the front-end devices and publishes them to each user terminal logged in to the back-end.
-
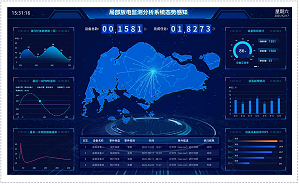
In the diagnostic operation mode, the back-end platform reads raw data from the front-end device, processes the data according to set of algorithms, and displays on the logged-in user terminals various analysis graphics and characteristic parameters, including PRPD map, PRPS map, feature clustering map, signal waveform, signal spectrum, power frequency period, etc.
- Regularly save and manage the alarm status information and raw data sent by each front-end device.
-
Retrieve, re-display and analyse the recorded PD data for the operators to evaluate the insulation condition of the power equipment through comparing the PD development trend.
|
|
|